

Frame Time vs FPS Explained: Why Smoothness Is More Than an Average
A practical guide to converting FPS into milliseconds, reading low-percentile results, spotting pacing problems, and avoiding misleading benchmark conclusions.
FPS is a rate; frame time is a duration
Frames per second tells you how many frames were delivered during a period. Frame time tells you how long one frame took. The two values are mathematical inverses: frame time in milliseconds equals 1000 divided by FPS, and FPS equals 1000 divided by frame time in milliseconds.
That means 60 FPS corresponds to about 16.67 ms per frame, 120 FPS to 8.33 ms, and 240 FPS to 4.17 ms. The relationship is not linear in the way many people intuitively expect. Moving from 30 to 60 FPS saves 16.67 ms per frame, while moving from 120 to 240 FPS saves 4.17 ms.
Use the converter instead of estimating
The NexusArc Frame-Time and FPS Converter converts average, 1% low, and 0.1% low FPS into milliseconds, compares them with a selected refresh-rate budget, and creates a portable summary. It does not manufacture a benchmark score; it exposes the arithmetic behind the numbers you enter.
Why average FPS is incomplete
An average can hide a short but disruptive event. Imagine 99 frames that each take 10 ms and one frame that takes 200 ms. Most of the run is fast, but the long frame is visible as a hitch. The average FPS may still look respectable because the fast frames outnumber the slow one.
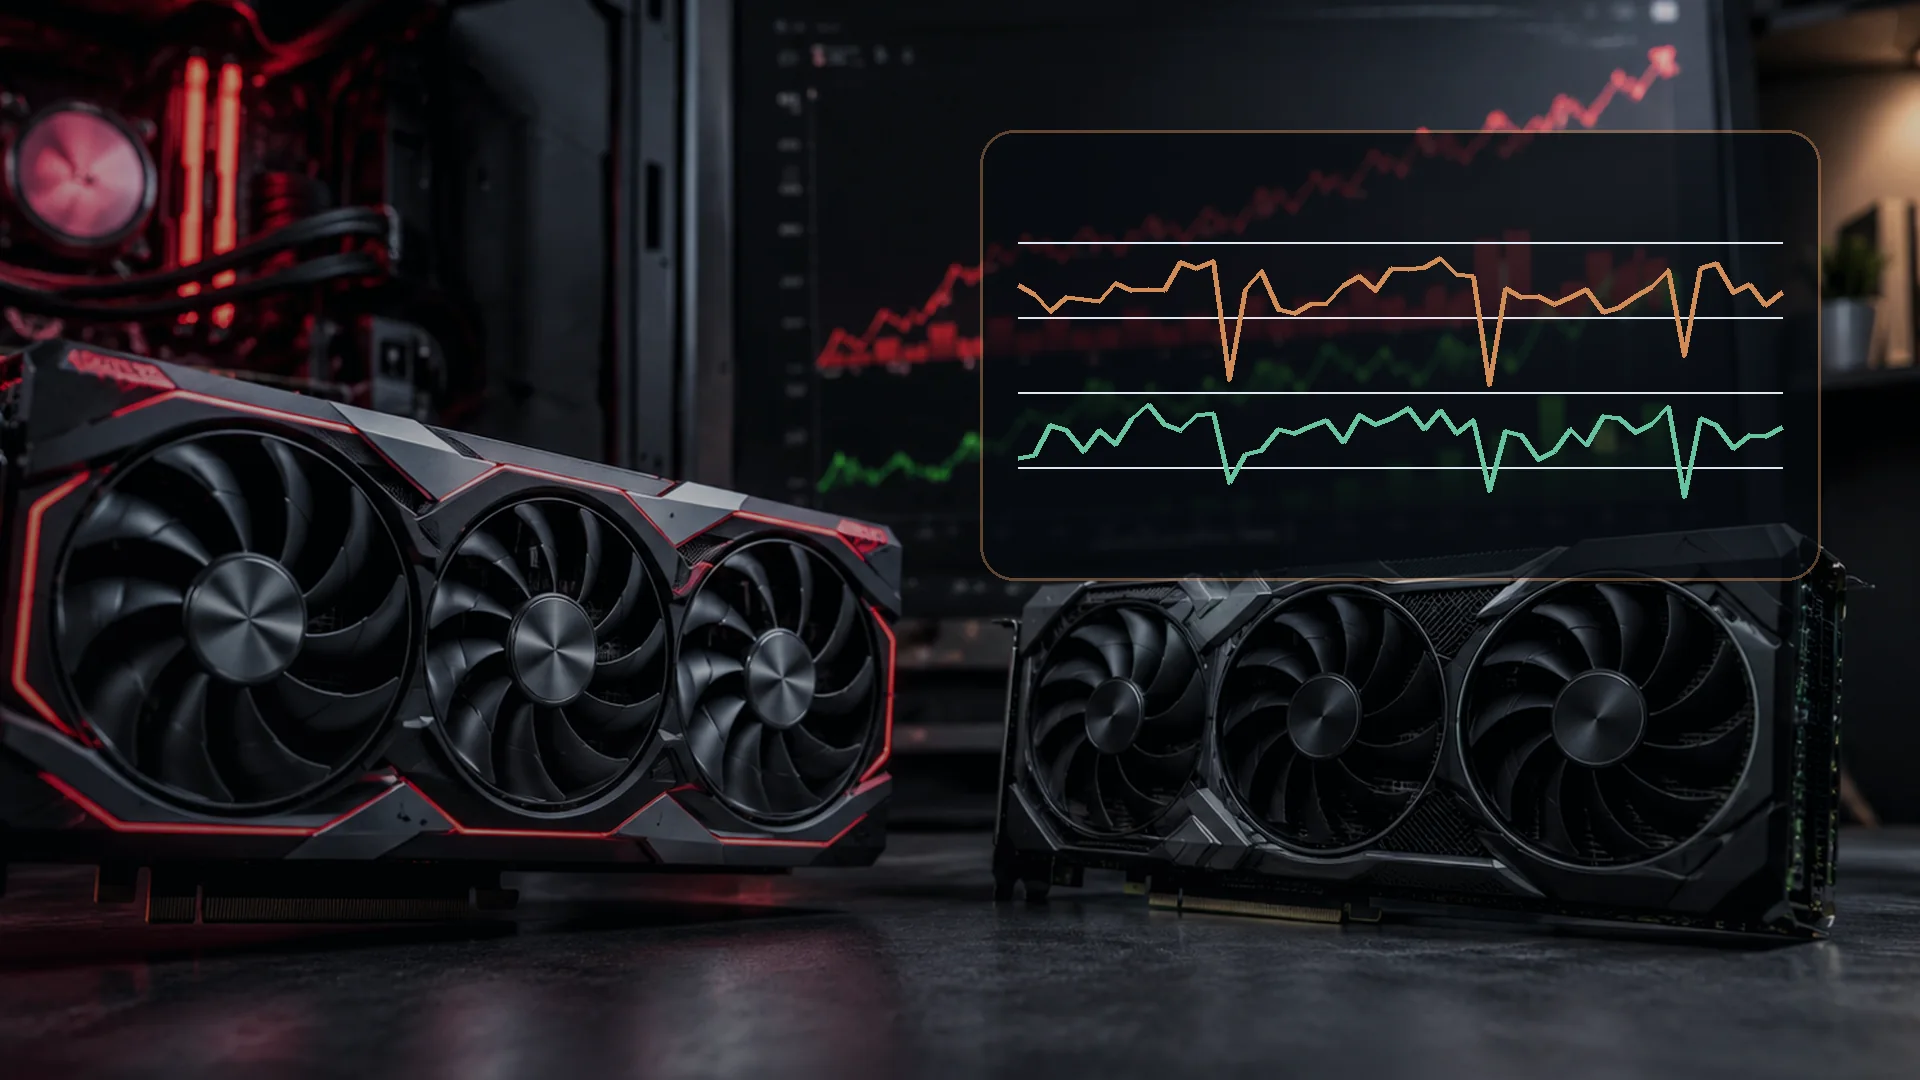
A frame-time graph keeps the event visible. A flat line indicates consistent delivery. Isolated tall spikes indicate long frames. A repeating sawtooth can suggest scheduling or synchronization behavior. A broad increase may indicate a sustained bottleneck rather than a one-time hitch.
What 1% low and 0.1% low mean
Low-percentile metrics summarize the slower tail of a run. Tools differ in their exact methodology, so two programs may not produce identical values from the same capture. The useful principle is consistent: a large gap between average FPS and low-percentile FPS means a meaningful part of the experience was slower than the headline average.
Do not treat one 1% low value as a universal quality grade. The length of the test, scene selection, warm-up, background tasks, and calculation method all matter. Repeat the same route and compare like with like.
Frame pacing is the spacing between delivered frames
Two runs can report the same average FPS but distribute frames differently. Consistent 16.7 ms delivery feels steadier than alternating 8 ms and 25 ms frames, even when the average rate is similar. This is why a frame cap that the system can sustain may feel better than an uncapped rate that oscillates sharply.
Variable refresh rate can reduce tearing and judder when display refresh follows frame delivery, but it does not erase long frames. A 70 ms CPU, shader, storage, or memory stall is still a 70 ms delay.
Refresh rate creates a frame budget
- 60 Hz: 16.67 ms per refresh
- 120 Hz: 8.33 ms
- 144 Hz: 6.94 ms
- 165 Hz: 6.06 ms
- 240 Hz: 4.17 ms
A frame that finishes inside the budget is ready for the next refresh opportunity, subject to presentation mode and synchronization. Missing a budget does not always mean a visible stutter, but repeated misses reduce the rate the display can show and can alter pacing.
Generated frames complicate the headline number
Frame generation inserts synthesized frames between traditionally rendered frames. The displayed frame rate may rise substantially while game simulation and input sampling still follow the underlying rendered rate. That can improve visual fluidity without producing the same responsiveness as a native rate. The DLSS, FSR, XeSS, and Frame Generation guide explains why base frame rate and latency controls still matter.
Common causes of long frames
- Shader or pipeline compilation when an effect appears for the first time.
- Asset streaming or traversal across a world boundary.
- CPU scheduling, background work, or a single busy game thread.
- GPU saturation after a demanding scene or ray-tracing transition.
- VRAM pressure that forces resource movement.
- Storage, decompression, or memory instability.
- Thermal or power limits that change sustained clocks.
The full PC game stutter diagnosis guide turns those possibilities into repeatable tests instead of random settings changes.
Capture a useful benchmark
- Use the same game version, driver, settings, route, and start state.
- Allow explicit shader compilation and background loading to finish.
- Record enough time to include normal variation, but do not combine unrelated scenes.
- Repeat the route to distinguish first-run events from persistent behavior.
- Record average, lows, and the frame-time trace.
- Note temperatures, clocks, VRAM pressure, and system changes.
PresentMon is one official open-source option for capturing CPU, GPU, and display frame durations and latencies on Windows. GPUView is a deeper Windows Performance Toolkit option when a developer-level trace is necessary.
Do not confuse frame time with input latency
Frame time is one part of the response chain. Input-device polling, game simulation, render queue, display scanout, pixel response, and synchronization also contribute. A lower frame time usually helps responsiveness, but the number is not a complete end-to-end latency measurement.
Power stability still belongs in the diagnosis
Power problems are less common than software or settings issues, but unstable overclocks, inadequate connectors, or protection trips can cause crashes and severe clock changes. Use the PC Power-Supply Estimator for a transparent planning envelope, then verify the recommendation with the hardware vendors and the PSU selection checklist.
The NexusArc takeaway
Use FPS to describe throughput and frame time to inspect delivery. Pair the average with low-percentile results and a trace. The most useful benchmark is not the one with the largest number; it is the one that exposes when, where, and why frames became slow.
Sources
- PresentMon: graphics performance capture and analysisIntel GameTechDev
- About GPUViewMicrosoft Learn
- PSO Precaching for Unreal EngineEpic Games

Harry Negron
Harry Negron leads NexusArc's editorial direction across games, player culture, gear, and technology.